The Overhead Waterfall: Where a Research Dollar Actually Goes
The widely repeated claim that two thirds of a research dollar disappears before it reaches a lab is wrong. The real leakage sits somewhere else entirely, and for capital allocators it is the more interesting number.
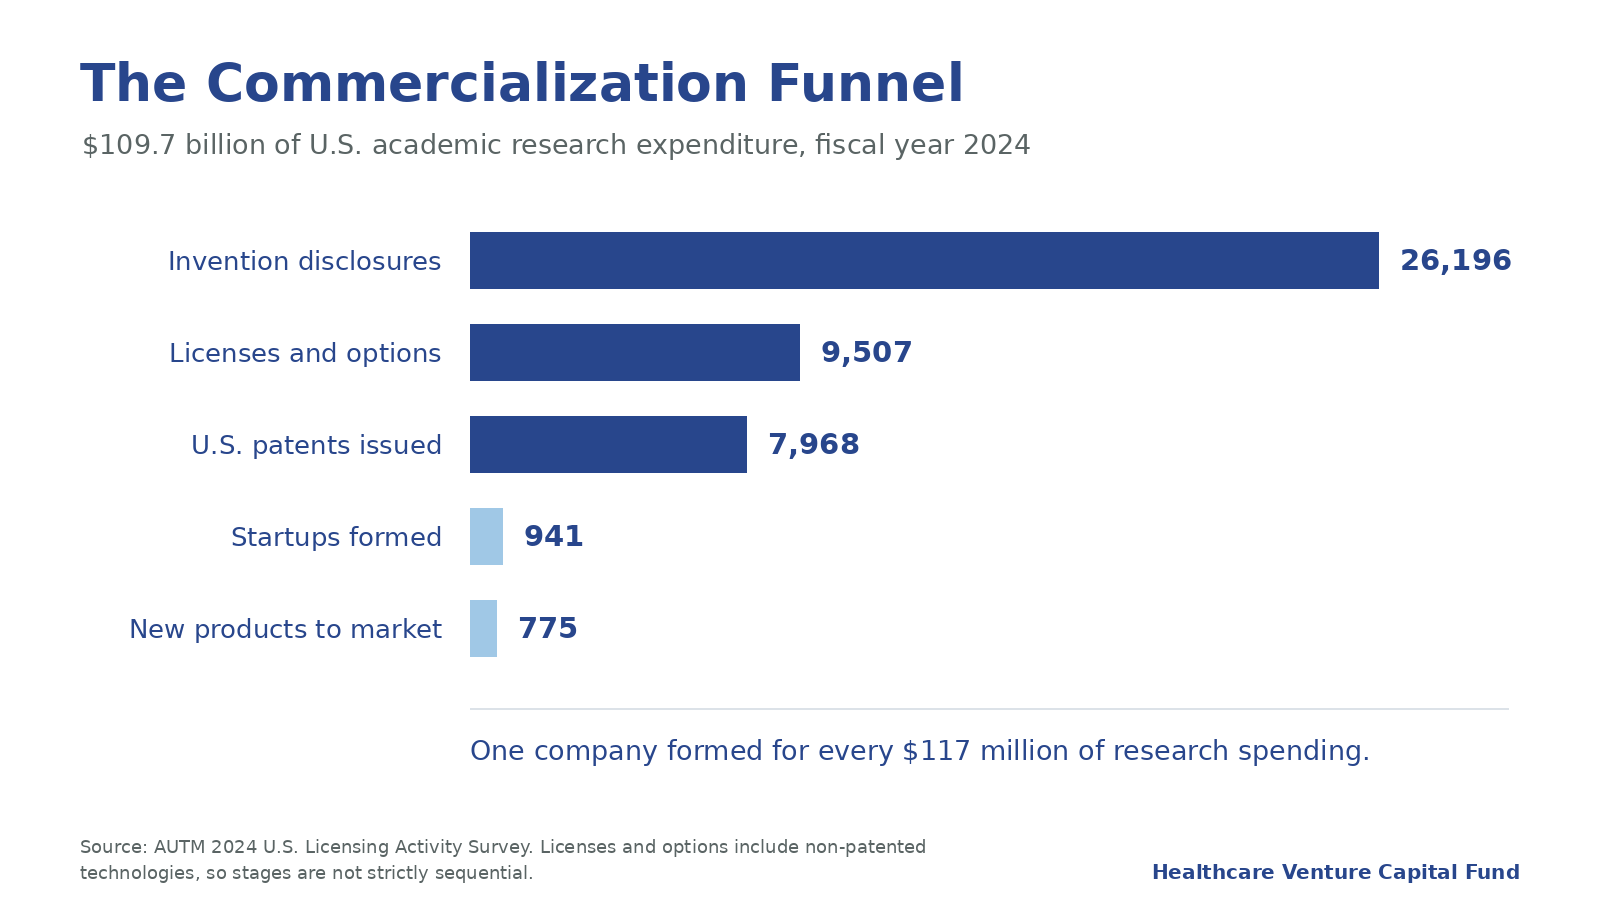
In fiscal 2024, American universities and academic institutions spent $109.7 billion on research. That spending produced 26,196 invention disclosures, 14,432 new U.S. patent applications, 9,507 executed licenses and options, 775 new products, and 941 new companies.
One company for roughly every $117 million of research expenditure. That single ratio is the entire commercialization question, and almost nobody in the current debate is arguing about it. They are arguing about overhead instead.
The number nearly everyone gets wrong
A version of this claim circulates constantly in venture and policy commentary: universities skim most of a federal grant before the science ever happens. The figure usually quoted is two thirds.
It is not close to correct, and understanding why matters, because the error hides where the money actually stalls.
Universities negotiate a facilities and administrative rate, commonly called F&A or indirect cost, with a cognizant federal agency. Research universities typically land between 50 and 70 percent, and some exceed 60 percent. Those headline percentages are what get quoted.
The percentages are not applied to the award. They are applied to a Modified Total Direct Cost base, which strips out equipment, tuition remission, patient care costs, rent, and everything past the first $25,000 of each subaward. The University of California publishes the arithmetic plainly: on a project with $10,000 in direct costs and a $6,000 MTDC base, a 50 percent negotiated rate yields $3,000 in indirect recovery. Total project cost $13,000, of which indirect represents about 23 percent.
NIH itself put average negotiated rates at 27 to 28 percent when it moved to cap them. So the honest range is somewhere near a quarter of total project cost, not two thirds. The popular claim overstates the leak by roughly a factor of three.
This is not a defense of university administration. It is a correction that redirects attention, because there is a real waterfall and it starts after the grant is spent.
The waterfall that actually exists
Run the fiscal 2024 numbers as a funnel and the shape becomes obvious.
26,196 inventions disclosed. 7,968 patents issued. 9,507 licenses and options executed. 775 products reaching the market. 941 companies formed.
Roughly one disclosure in twenty eight becomes a company. Roughly one in thirty four becomes a product. The attrition between a scientist filing paperwork and anything reaching a patient is not a financing problem in the conventional sense, because most of these inventions never get far enough to be evaluated by an investor at all.
For allocators accustomed to reading deal flow, that is the material fact. The top of the funnel is enormous, federally subsidized, and almost entirely unpriced. The conversion machinery attached to it is thin.
The second waterfall: what the scientist actually keeps
There is a second distribution that shapes behavior more than most investors realize, and it is the one governing what an inventor personally receives.
Stanford distributes patent income after deducting licensing office operating costs and unreimbursed legal expenses, then allocates 33.34 percent to the inventor, with the balance split among department, school, and the research office. The University of Connecticut uses a comparable one third inventor share.
Two institutions have moved deliberately in the other direction. Yale restructured in 2022 to distribute 100 percent of net income from new technologies to inventors and their academic units, raising the top tier inventor share to 30 percent with new fixed allocations to the originating lab and department. Arizona State revised its policy effective November 2023 so that inventors receive between 40 and 50 percent of net royalties on a sliding scale tied to the number of listed inventors, with the university share fixed at one third.
The pattern worth noting is directional. Institutions competing for translational faculty are increasing inventor share. That is a market signal about where the scarce resource sits, and the scarce resource is not capital. It is scientists willing to spend three to five years on commercialization rather than on the next grant cycle.
What the indirect cost fight settled, and what it did not
On February 7, 2025, NIH issued supplemental guidance capping indirect cost reimbursement at 15 percent for new and existing grants. The policy never took effect. A temporary restraining order landed three days later, a nationwide preliminary injunction followed on March 5, and the District of Massachusetts entered a permanent injunction on April 4, 2025, finding that NIH had violated statute, acted arbitrarily, and failed to follow rulemaking procedure.
The First Circuit upheld that ruling on January 5, 2026, reading NIH’s own public claim of $4 billion in annual savings as an admission that the agency intended to withhold $4 billion. The Department of Justice then let the April 6, 2026 deadline to petition the Supreme Court pass without filing, leaving the injunction permanently in force.
Congress reinforced the outcome. The Consolidated Appropriations Act, 2026 continued the longstanding provision barring HHS from unilaterally deviating from negotiated rates.
For anyone underwriting exposure to university research infrastructure, that is a two part read. Near term, the F&A structure is legally stable and not subject to executive reset. Longer term, the administration proposed the 15 percent cap again in its FY2027 budget request along with elimination of the appropriations prohibition, which means this is a recurring policy risk that is currently dormant rather than resolved.
The private layer forming in the gap
If the constraint is conversion rather than capital, the interesting institutions are the ones supplying judgment instead of money.
The Creative Destruction Lab, founded in 2012 at the University of Toronto’s Rotman School of Management, now operates across roughly 15 universities and more than 25 innovation streams. More than 4,500 companies have gone through it, and CDL reports more than CAD $51 billion in equity value created through the program. It charges no fees and takes no equity. Ventures run a nine month cycle built around full day objective setting sessions, and those that miss their objectives are culled.
The economics are worth sitting with. A structure that takes neither fees nor equity, and whose only currency is founder performance and mentor deal access, has produced equity value at a scale most seed funds do not reach. That is evidence that the binding constraint in science commercialization is sequencing and judgment, not dollars.
It also means the opportunity here is not a fund. It is a services, network, and intelligence layer that sits between the disclosure and the financeable company.
The infrastructure read
One figure in the fiscal 2024 data has direct bearing on physical assets: 6,936 university startups were still operational at the close of the year, and historically roughly two thirds of these companies remain in their institution’s home state.
That is an unusually predictable formation pattern. Research concentration is measurable in advance, published annually, and geographically sticky. Where those companies cluster, demand follows for wet lab space, clinical trial capacity, and eventually outpatient delivery footprint.
We would characterize the link between research concentration and medical office absorption as a lagging correlation rather than a demonstrated causal relationship, and it operates on a multi year delay. But it is directionally legible, which is more than can be said for most demand signals in healthcare real estate.
What this means for allocators
Three things follow.
First, discount the overhead narrative. It is arithmetically wrong by a wide margin, and any thesis built on the premise that universities are skimming two thirds of federal science funding is built on a misreading of how the F&A base is calculated.
Second, underwrite the conversion gap instead. Twenty six thousand disclosures producing 941 companies is the actual inefficiency, and it is one that better sequencing and mentorship demonstrably improve without requiring capital at risk.
Third, watch the FY2027 appropriations line. The indirect cost cap is currently blocked in perpetuity by injunction, but it has been proposed by two administrations now, and a successful future attempt would reprice the operating economics of every research university in the country.
Healthcare Discovery tracks the science and the institutions producing it. Healthcare Real Estate Fund holds the physical infrastructure that healthcare delivery expansion eventually requires. This publication sits between them, reading capital flows in the space where research becomes a company and a company eventually becomes a building.
For the research and clinical perspective on university science commercialization, see the companion coverage at Healthcare Discovery, including our reporting on academic scientists moving into privately funded research infrastructure.